The chart below indicates the environmental impact of the business operations of the OLC Group in FY2024. For example, Tokyo Disney Resort’s environmental efforts touch on a variety of areas including energy management, water processing, waste management, and recycling activities. We give due consideration to a range of environmental factors to reduce the burden on the global environment produced by our business activities.
Inputs (i.e., external factors that contribute to the environmental impact of our operations) include energy (electricity, city gas, fuel, etc.), water (clean water), various goods, equipment and food. Outputs (i.e., emissions resulting from our business activities) include carbon dioxide, wastewater released into the sewage system, and waste (including valuable resources).
The environmental impact mass balance, changes in CO₂ emissions, and yearly data cover approximately 98% of the OLC Group’s direct business areas (Theme Park Segment, Hotel Business Segment, and Other Business Segment) in terms of FY2024 net sales composition.
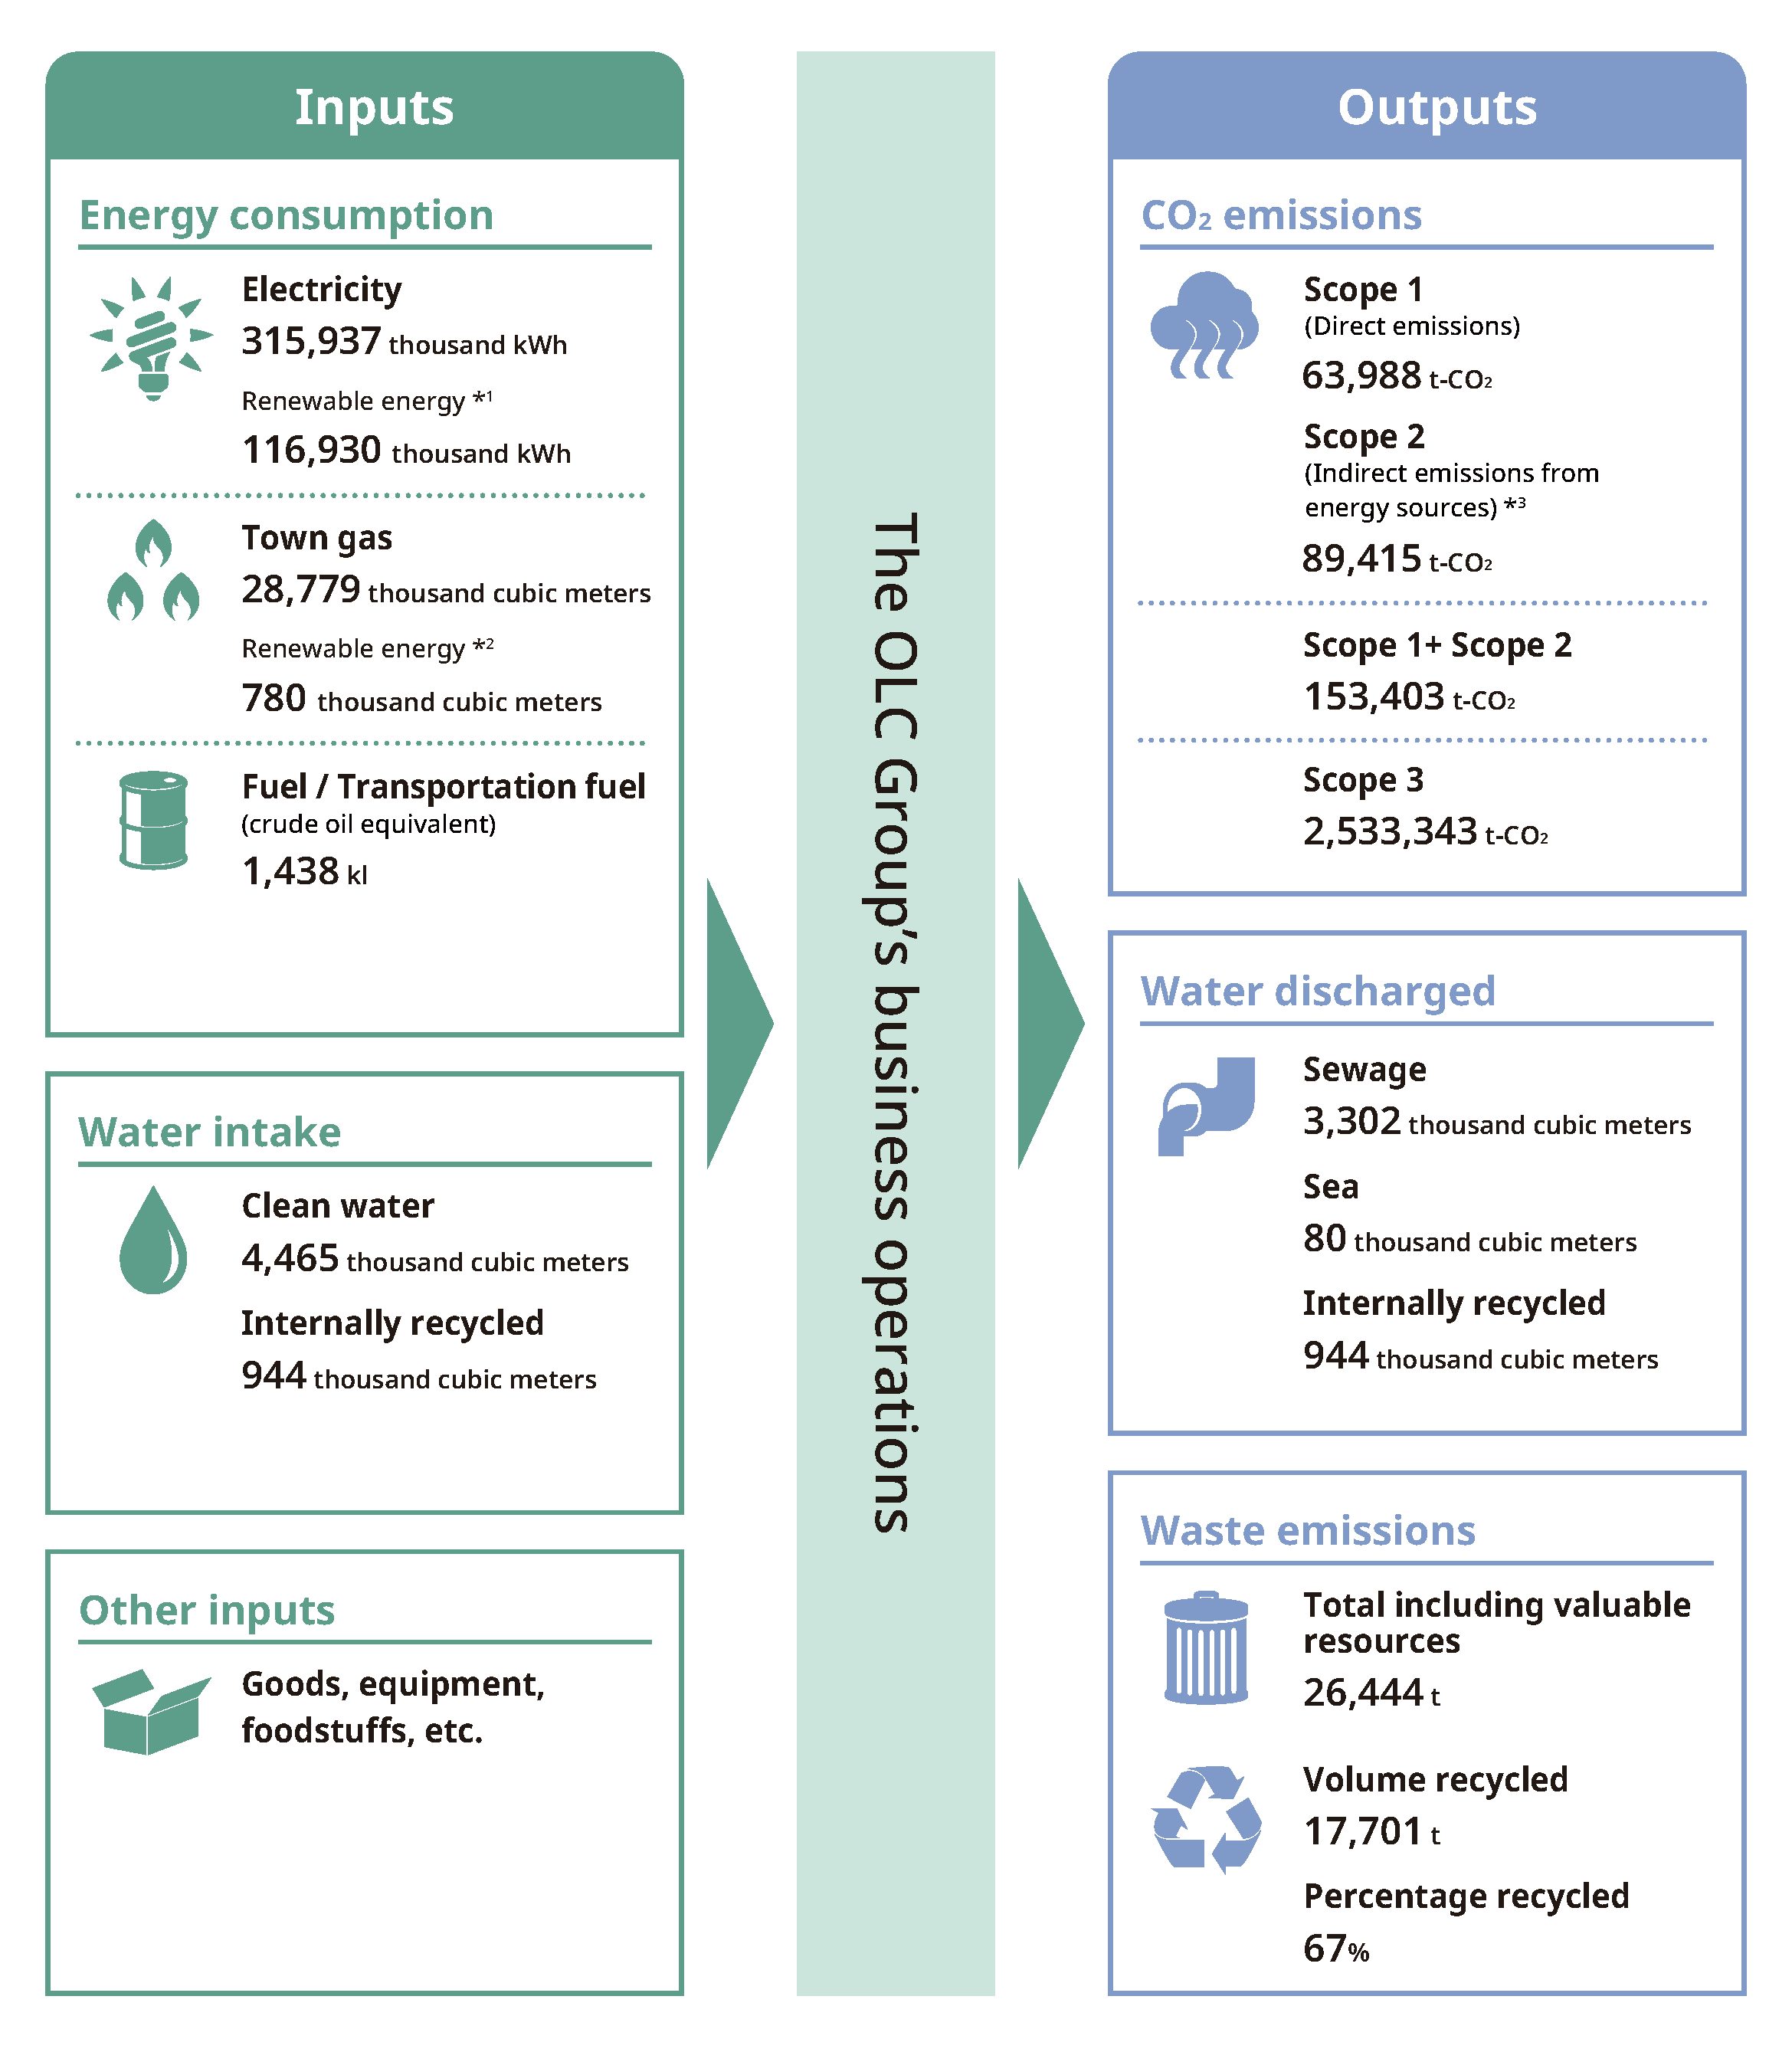
*1 In-house power generation by solar panels (all consumed by in-house operations), procurement of electricity with non-FIT non-fossil certificate
*2 Procurement of carbon-neutral town gas
*3 Scope 2 emissions are calculated based on the market-based method.
|
Inputs |
FY2020*1 |
FY2021*1 |
FY2022 |
FY2023 |
FY2024 |
||
|
Energy consumption |
Total energy consumption (GJ) |
2,884,200 |
3,212,400 |
3,817,802 |
4,255,943 |
4,522,755 |
|
|
Electricity (GJ) |
1,972,400 |
2,261,200 |
2,343,404 |
2,785,547 |
3,085,748 |
||
|
Renewable energy (GJ) |
6,191 |
111,500 |
211,234 |
499,704 |
1,141,237 |
||
|
Town gas (GJ) |
888,900 |
922,200 |
1,398163 |
1,332,601 |
1,295,060 |
||
|
Renewable energy (GJ) |
0 |
13,800 |
16,200 |
25,380 |
35,100 |
||
|
Fuel (GJ) |
22,900 |
29,100 |
55,433 |
55,480 |
55,721 |
||
|
Others(GJ) |
- |
- |
20,802 |
82,315 |
86,226 |
||
|
Water intake |
Total intake(thousand ㎥) |
2,560 |
3,101 |
4,583 |
5,660 |
5,825 |
|
|
Surface water (wells and boreholes)(thousand ㎥) |
- |
- |
268 |
430 |
416 |
||
|
Clean water(thousand ㎥) |
2,100 |
2,500 |
3,526 |
4,270 |
4,465 |
||
|
Internally recycled water (thousand ㎥) |
460 |
601 |
789 |
960 |
944 |
||
|
Outputs |
FY2020*1 |
FY2021*1 |
FY2022 |
FY2023 |
FY2024 |
||
|
CO₂ emissions*2 |
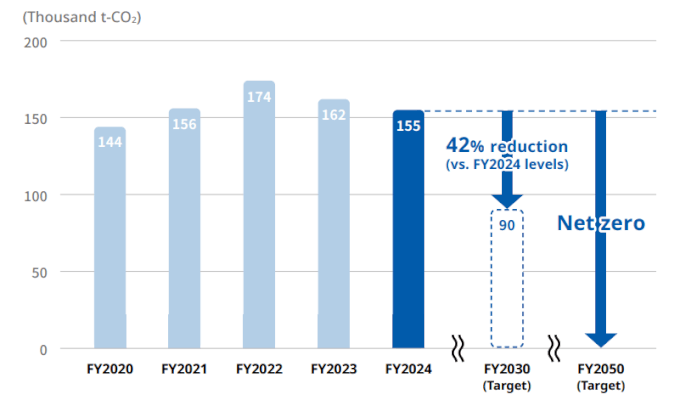
Scope 1 + Scope 2(t-CO₂) |
135,000 |
146,000 |
173,627 |
162,623 |
153,403 |
|
|
Scope 1(t-CO₂) |
46,000 |
48,000 |
74,866 |
71,424 |
63,988 |
||
|
Scope 2(t-CO₂) |
89,000 |
98,000 |
98,761 |
91,201 |
89,415 |
||
|
Water discharged |
Total water discharged(thousand ㎥) |
1,928 |
2,461 |
3,485 |
4,329 |
4,326 |
|
|
Sewage/water treatment facilities(thousand ㎥) |
1,400 |
1,800 |
2,620 |
3,291 |
3,302 |
||
|
Sea(thousand ㎥) |
68 |
61 |
76 |
78 |
80 |
||
|
Internally recycled(thousand ㎥)*3 |
460 |
601 |
789 |
960 |
944 |
||
|
Waste generation |
Total including valuable resources(t) |
13,223 |
17,263 |
24,412 |
26,338 |
26,892 |
|
|
Volume recycled(t) |
9,655 |
12,578 |
17,284 |
18,603 |
18,126 |
||
|
Percentage recycled (%) |
74 |
73 |
71 |
71 |
67 |
||
|
Incineration/landfill disposal volume (t) |
3,568 |
4,685 |
6,341 |
6,961 |
8,743 |
||
|
Total food waste(t) |
1,214 |
1,758 |
2,293 |
2,534 |
2,052 |
||
*1 The data up to FY2021 pertain to Tokyo Disney Resort
*2 Tokyo Electric Power Company’s adjusted emissions factor is used to calculate CO₂ emissions from electricity consumption.
Includes CO₂ emissions from transportation.
CO₂ emissions include emissions of hydrofluorocarbons (HFCs) from FY2022.
Scope 2 emissions are calculated based on the market-based method.
*3 Added the FY2023 actual results for Theme Parks, hotels, and Ikspiari to the amount of water recycled at owned facilities
*Scope 2 emissions are calculated based on the market-based method.
(t-CO₂)
|
Category |
Emissions(ratio) |
Calculation method |
||
|
FY2022 |
FY2023 |
FY2024 |
||
|
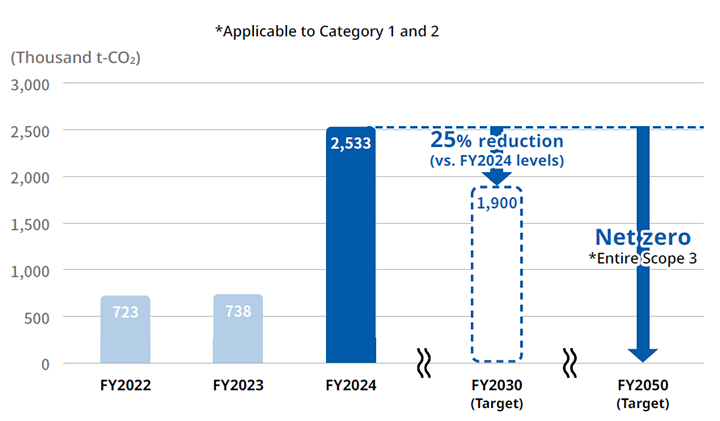
Total |
792,234 |
810,893 |
2,533,343 |
|
|
1.Purchased goods and services |
455,551 (57.5%) |
564,312 (69.6%) |
844,279 (33.3%) |
Calculated by aggregating the total value of OLC’s major procured products (by item) and the total amount of water consumed by the OLC Group, and multiplying them by the emissions unit value*1,2 |
|
2.Capital goods |
268,313 (33.9%) |
173,846 (21.4%) |
1,541,219 (60.8%) |
Calculated by multiplying the value of the OLC Group's fixed assets by the emissions unit value*1 |
|
3.Fuel- and energy- related activities not included in Scope 1 or 2 |
32,253 (4.1%) |
32,157 (3.0%) |
32,072 (1.3%) |
Calculated by multiplying the amount of energy consumed by the OLC Group by the emissions unit value*1,3 for each energy type |
|
4.Upstream transportation and distribution |
2,425 (0.3%) |
2,617 (0.3%) |
14,896 (0.6%) |
Calculated by multiplying the value of OLC’s transportation and the amount of fuel consumed by contractors by the emissions unit value*1 |
|
5.Waste generated in operations |
9,766 (1.2%) |
10,820 (1.3%) |
11,533 (0.5%) |
Calculated by classifying the waste generated in the business activities at Tokyo Disney Resort by disposal method, and multiplying the weight of the disposed waste by the emissions unit value*1,3 |
|
6.Business travel |
167 (0.0%) |
385 (0.05%) |
347 (0.0%) |
Calculated by multiplying the total number of days of overseas and domestic business travel by OLC’s full-time employees and contract workers by the emissions unit value*1 |
|
7.Employee commuting |
8,001 (1.0%) |
9,249 (1.1%) |
10,973 (0.4%) |
Calculated by multiplying the total number of commuting days of OLC’s full-time employees and contract workers by the emissions unit value*1 |
|
8.Upstream leased assets |
- |
- |
- |
Not applicable for calculation (All energy consumed by assets leased under upstream lease agreements are included in Scope 1 or 2.) |
|
9.Downstream transportation and distribution |
1,939 (0.2%) |
2,932 (0.4%) |
1,771 (0.1%) |
Calculated by multiplying the net sales of distributed OLC merchandise by the emissions unit value*3 |
|
10.Processing of sold products |
- |
- |
- |
Not applicable (Processing of sold products is not relevant in our business activities.) |
|
11.Use of sold products |
- |
- |
- |
Not applicable for calculation (The amount of GHG emissions in the use of sold products is considered to be low in our business activities.) |
|
12.End-of-life treatment of sold products |
13,819 (1.7%) |
14,575 (1.8%) |
18,181 (0.7%) |
Calculated by multiplying the sales volume of OLC’s major products sold by the emissions unit value*1,3 to conduct weight conversion, and multiplying the result by the emissions unit value*1,3 for each product |
|
13.Downstream leased assets |
- |
- |
21,083 (0.8%) |
Calculated by multiplying the amount of energy consumed by tenants by the emissions unit value*1,3 for each energy type |
|
14.Franchises |
- |
- |
- |
Not applicable (Franchises are not relevant in our business activities.) |
|
15.Investments |
- |
- |
36,989 (1.5%) |
Calculated by multiplying the investment ratio in affiliated companies and specified investment shares by their respective emissions |
*1 Database of emissions unit values for calculating the emissions of greenhouse gases, etc. of an organization through its supply chain (Ver. 3.5), Ministry of the Environment
*2 Environmental measure B303, FY2020 Water Supply Business Guidelines performance indicators, Public Enterprises Bureau, Chiba Prefectural Government
*3 Inventory Database for Environmental Analysis (IDEA) Ver.3.5
*4 Category 2 rose in FY2024 due to an increase in fixed assets associated with the development of Fantasy Springs.
(Emissions from Group companies were calculated by multiplying the OLC Group’s emissions by the composition of consolidated net sales.)
(thousand cubic meters)
|
FY2022 |
FY2023 |
FY2024 |
||
|
Total water intake |
4,583 |
5,660 |
5,825 |
|
|
Breakdown by source |
Surface water (rivers and lakes) |
0 |
0 |
0 |
|
Surface water (wells and boreholes) |
268 |
430 |
416 |
|
|
Water used at quarries |
0 |
0 |
0 |
|
|
Public water |
3,526 |
4,270 |
4,465 |
|
|
Internal water recycling facilities |
789 |
960 |
944 |
|
|
Rainwater |
0 |
0 |
0 |
|
|
Seawater |
0 |
0 |
0 |
|
|
Total water discharged |
3,485 |
4,329 |
4,326 |
|
|
Breakdown by discharge destination |
Sea |
76 |
78 |
80 |
|
Surface water |
0 |
0 |
0 |
|
|
Wells/underground water |
0 |
0 |
0 |
|
|
Water treatment facilities |
2,620 |
3,291 |
3,302 |
|
|
Internal water recycling facilities |
789 |
960 |
944 |
|
(t)
|
FY2021 |
FY2022 |
FY 2023 |
FY2024 |
|
|
COD emissions |
0.5 |
0.6 |
0.8 |
0.6 |
*Chemical Oxygen Demand
|
FY2022 |
FY2023 |
FY2024 |
|
|
Waste emissions (Total incuding valuable resouces) |
24,412t |
26,338t |
26,444t |
|
Hazardous waste |
39t |
12t |
22t |
|
Percentage recycled |
71% |
71% |
67% |
Waste generated on this chart is that entrusted to recycling for The Japan Container and Packaging Recycling Association based on The Containers and Packaging Recycling Law.
(t)
|
|
FY2020 |
FY2021 |
FY2022 |
FY2023 |
FY2024 |
||
|
Glasses |
Total |
1 |
19 |
2 |
1 |
2 |
|
|
Collected |
0 |
0 |
0 |
0 |
0 |
||
|
Waste |
1 |
19 |
2 |
1 |
2 |
||
|
Paper packaging |
Total |
772 |
744 |
1,482 |
1,482 |
1,493 |
|
|
Collected |
354 |
0 |
0 |
0 |
0 |
||
|
Waste |
418 |
744 |
1,482 |
1,482 |
1,493 |
||
|
Plastic packaging |
Total |
711 |
643 |
1,308 |
1,391 |
917 |
|
|
Collected |
69 |
0 |
0 |
0 |
0 |
||
|
Waste |
642 |
643 |
1,308 |
1,391 |
917 |
||
|
PET bottle |
Total |
67 |
88 |
203 |
202 |
249 |
|
|
Collected |
67 |
88 |
203 |
202 |
249 |
||
|
Waste |
0 |
0 |
0 |
0 |
0 |
||
Tokyo Disney Resort
|
KPI |
Results |
||||
|
2024 Medium-term Plan |
2022 |
2023 |
2024 |
||
|
Waste reduction target [weight] (vs. FY 2016 levels) [Output]*1 |
- |
4.8% reduction |
1% increase |
2.6% increase |
|
|
Food loss reduction target (vs. FY 2019 levels) |
22.5% reduction |
24.5% reduction |
15.9% reduction |
32.4% reduction |
|
|
Single use plastics reduction target (vs. FY 2018 levels) [Input]*2 |
10.5% reduction |
20.1% reduction |
6.4% reduction |
4.7% increase |
|
|
Resource saving target on products and services (vs. FY 2018 levels) |
4.4% reduction |
11.8% reduction |
12.5% reduction |
14.3% reduction |
|
|
Percentage recycled [Recycling]*3 |
- |
73% |
72% |
69% |
|
*1 Output: Discharge of resources
*2 Input: Inflow of resources
*3 Recycling: Recycling of resource
*The FY2023 result increased significantly due to a legal revision, which resulted in the inclusion of chemical substances primarily contained in cleaning agents in the PRTR list.
|
Substance Release |
Transfer volume (Ratio) |
|
Nitrilotriacetic acid and its sodium salt |
10.4t (43.6%) |
|
Ethylenediaminetetraacetic acid and its potassium and sodium salts |
2.3t (9.6%) |
|
Cyclohexane |
1.7t (7.2%) |
|
Salt of didecyl(dimethyl)ammonium |
1.3t (5.3%) |
|
2-(N-Dodecyl-N,N-dimethylammonio)acetate |
1.2t (4.9%) |
|
Others |
7.0t (29.5%) |
(t)
|
FY2020 |
FY2021 |
FY2022 |
FY2023 |
FY2024 |
|
2.6 |
3.9 |
3.2 |
2.5 |
2.2 |
* Conducted a voluntary survey of 100 main VOCs listed by the Ministry of the Environment.
* VOC volume of FY2021 has been revised due to review of past data.
|
FY2021 |
FY2022 |
FY2023 |
FY2024 |
|
|
Serious environment-related accidents |
0 |
0 |
0 |
0 |
|
Environment-related penalties |
0 |
0 |
0 |
0 |
We have specified "Measures to address climate change and natural disasters" and “Recycling-oriented society” as areas of our ESG Materiality to achieve our vision for the period leading up to 2035, and have set specific targets.
Related information